Technical basis

Selected scientific figures from the founder’s SINTEF biocarbon process and techno-economics report (Restricted, 2015). Shown for technical context. Cost and CAPEX charts are not published on this site.
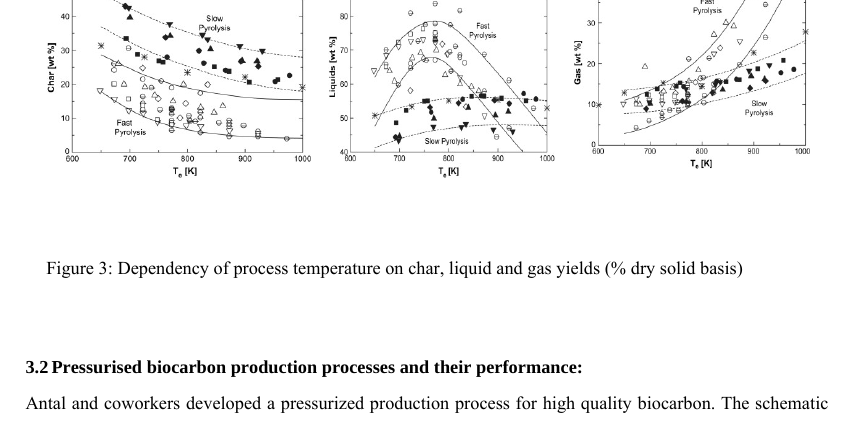
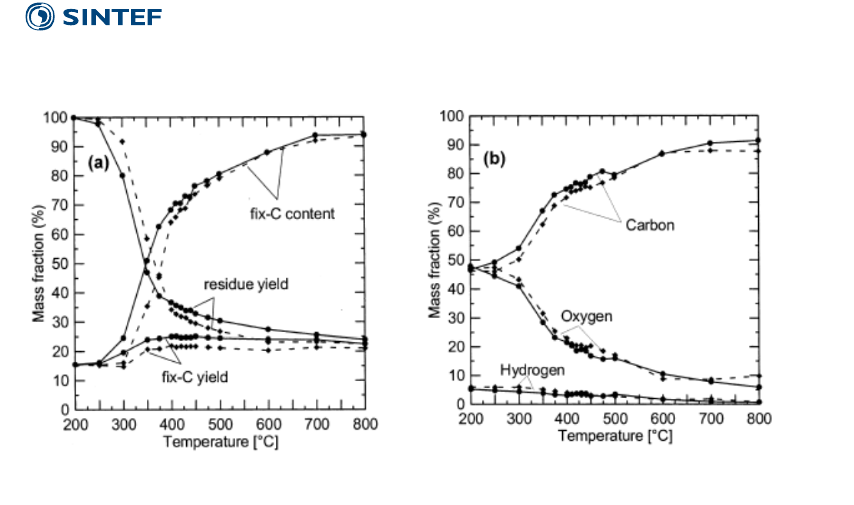
Figure 3: Dependency of process temperature on char, liquid and gas yields
Figure 3 — Dependency of process temperature on char, liquid and gas yields (% dry solid basis). Source: Kempegowda & Skreiberg, Biocarbon production process and its Techno-economics, SINTEF Energy Research, 2015 (Restricted).
Figure 6: Effects of temperature and heating rate on beech char yields and CHO contents
Figure 6 — Effects of temperature and heating rate on (a) yields and (b) CHO contents of beech chars. Source: Kempegowda & Skreiberg, SINTEF Energy Research, 2015 (Restricted).
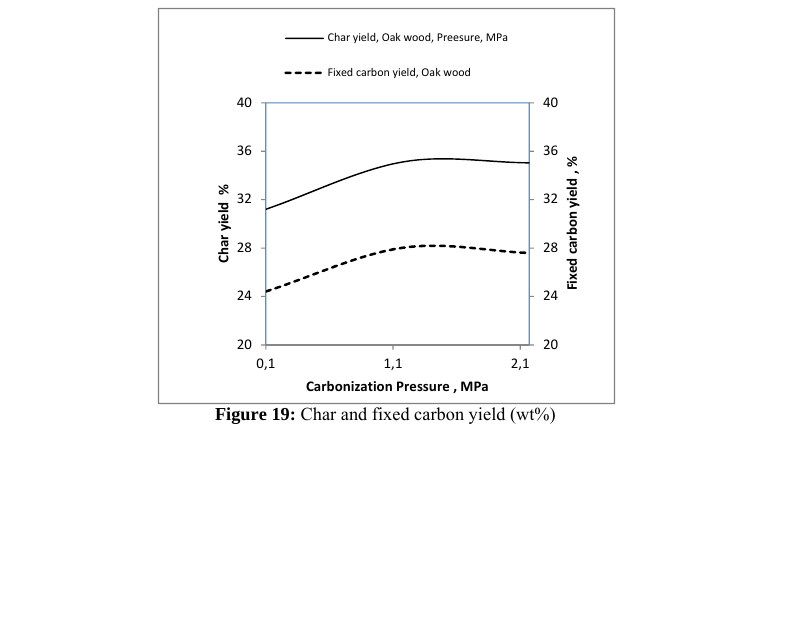
Figure 19: Char and fixed carbon yield versus carbonization pressure
Figure 19 — Char and fixed carbon yield (wt%) versus carbonization pressure. Source: Kempegowda & Skreiberg, SINTEF Energy Research, 2015 (Restricted).
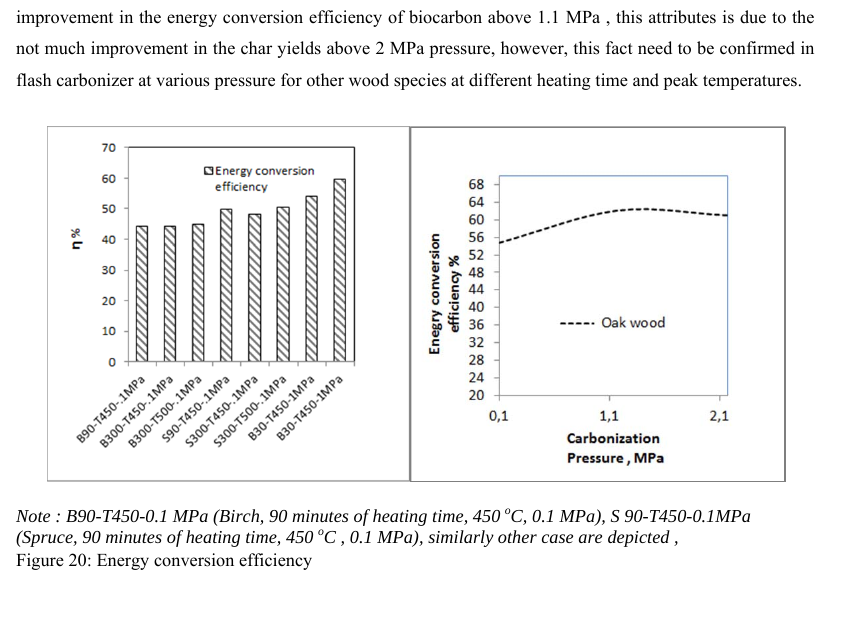
Figure 20: Energy conversion efficiency
Figure 20 — Energy conversion efficiency. Source: Kempegowda & Skreiberg, SINTEF Energy Research, 2015 (Restricted).